
“He had one hand in the oven and a leg in the freezer. On average he felt fine.”
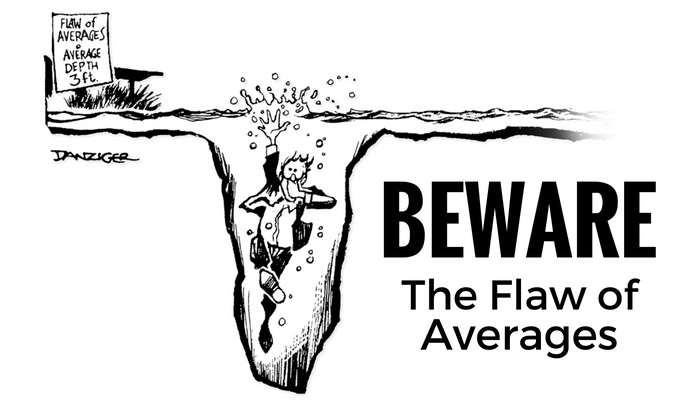
“Hear about the statistician who drowned crossing a river?
It was three feet deep on average.”
If you had read my previous article, you might be think that you would make a good return if you put all or much of your money in the stock market index.
The inconvenient truth is more nuance. Here’s an example that I came across.
Meet Sally, who started investing money in the S&P 500 in 1991.
By 1995, she had achieved 4 years of returns at 12% per year. Nice!
By 1999, she had achieved 8 years of returns at 17% per year. Whoa! Could you blame Sally for thinking her investing ride was particularly blessed? A proverbial rocket ship?
But then the Dot Com Bubble burst. By 2003, Sally’s portfolio had fallen back to Earth. She’d been invested for 12 years at point, but the crash dropped her average return to 8% per year.
And then even more bad news. The Great Financial Crisis occurred in ’07 and ’08, and by 2009, Sally’s portfolio had achieved 18 years of 3.5% annual returns(emphasis mine). That’s terrible. It had been two decades for Sally and her portfolio was at half the annualized return that was “promised.” The path dependency here must have felt terrible.
Of course, if Sally had stayed invested (and this is an all-important if), the 2010s bull market made her whole. By 2021, Sally would have seen a full 30 years of investing and achieved an 8% annual return.
The Flaw of Averages
You will often come across terms like average returns or expected returns. But there’s no such thing as a “8% per year” average in the stock market. In the short run? It can be anything.
Well then I just have to assume that it is 8% for 30-years period right?
Not quite.
This time, let’s meet Nick and Nancy. The year is 1966.
Nick and Nancy are 63 years old. The couple has accumulated $3,000,000 in savings. Nice!
Nancy came across some investment website that told her the stock market’s average annual return will be 8% over 30+ year period.
Based on this assumption, she puts together a plan for how much money they can take out of their savings each year and make the money last until they are both 95.
The plan: Invest at 8% in the Dow Jones Industrial Average (another index like the S&P 500) and withdraw $180,000 +3% each year to account for inflation.
Here’s how much money they would have each year after investing and withdrawing the money.
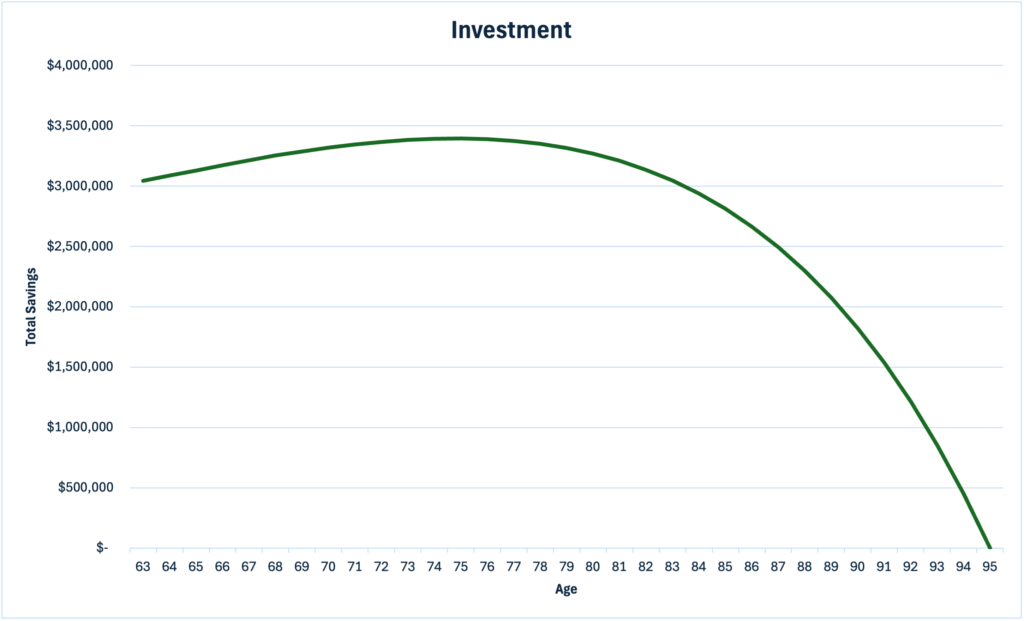
Their total wealth peaks at around age 75 near $3.5 million before tapering off aggressively toward 95.
Nick and Nancy are all set, right?
Unfortunately, not quite so.
The average return of the Dow index was indeed 8%. However, look closer at the chart below and you will see a problem.
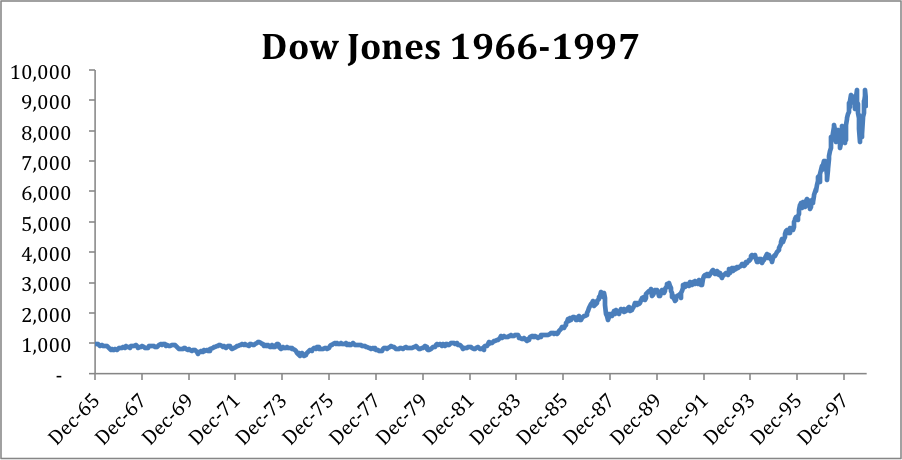
Between 1966 and 1982, there were essentially no returns. The index kept hovering around 1000. Then, from 1982 through 1997 the Dow grew at over 15% per year taking the index from 1000 to about 8000.
What are the implications for Nick and Nancy?
As shown in the green line below, they will deplete their funds at 79 instead of the “promised” 95.
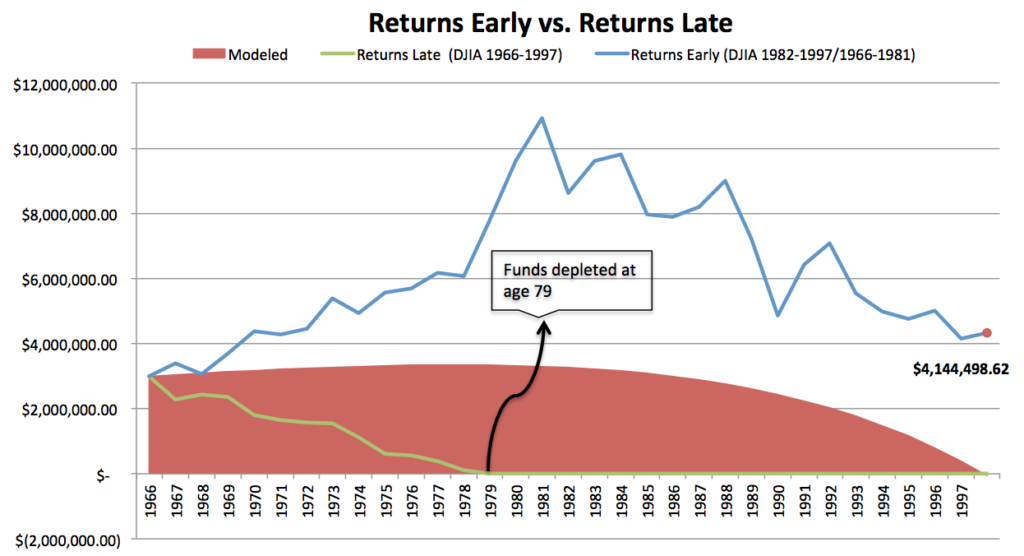
If we could reverse history, and make the market gains happening early between 1966-1982, they would have achieved returns like the blue line and do even better than Nancy’s initial expectations instead.
Unfortunately, we can’t predict which is which.
Plan for Failure
While investing in the US stock market index has worked out well over the past decades, the yearly returns are unequal and unpredictable.
This is why it is extremely important that you have other sources of income or savings that can allow you to weather out periods of stock market crashes or if the stock market does not perform to average expectations.
This applies not just to stock investing but also other areas like your house. Here’s something I came across.
Past performance is no guarantee of future results. It is likely, but not always.
If you want to go fast, invest in good brakes. If you want to take risks, invest in a good backup plan.
Read more
- Why Choose Interactive Brokers & How to Get Free Shares worth up to USD $1000
-
Here’s How Much it Costs to Buy T-bills versus SGOV ETF on IB
Featured image:
Artist: Jeff Danziger, Source: The Flaw of Averages: Why We Underestimate Risk in the Face of Uncertainty